

Presented By
![]()
View in web for best experience
Q1 ends today. Which means somewhere, a VP of Operations is refreshing a dashboard, a plant manager is scrambling to hit a line efficiency number, and a finance team is about to declare a "transformational year for digital manufacturing" — based entirely on a pilot program involving four sensors and a spreadsheet.
It's also 2 days before April Fools... Make of that what you will.
Here's the thing: a lot of what passes for "insight" in industrial tech is really just... vibes. Dashboards that look impressive but don't answer the right questions. AI tools that seem to work until they quietly don't. Automation pipelines that run fine until nobody can explain why they're running fine — and then they break.
This week, we're in a "lift the hood" kind of mood.
The four things we cover this issue all share a theme: visibility. Understanding what's actually happening inside your systems — not what the demo showed, not what the vendor promised, but what's literally executing, step by step, under the surface. That includes an honest (and uncomfortable) look at AI coding agents, a clever trick for making complex automation pipelines visual, a guide to one of the most powerful Windows debugging tools ever built, and a major update to the infrastructure layer that might just be the future of how manufacturers run mixed VM and container workloads.
Here's what caught our attention this week:
AI Coding Agents Are Powerful. Here's the Part Nobody's Talking About.
Everyone's vibe-coding now. Spotify's best developers reportedly haven't written a line of code since December. Notion is leaning hard into AI-generated software. Stripe is experimenting with one-shot end-to-end coding agents. And the productivity numbers are genuinely hard to argue with — teams shipping faster, prototypes in hours instead of weeks, junior devs punching well above their weight.
So yes, AI coding agents are real, they're useful, and they're here to stay.
But a developer named Joel Andrews just published something worth reading before your team goes all-in — especially if any of that code is touching industrial systems.
The details:
Andrews runs a Slack standup bot — built without a single line of AI-generated code, he's proud to mention — and lays out four structural risks that rarely make it into the hype cycle:
1. Skill atrophy — real, but overstated. When engineers stop writing code and become "AI supervisors," their ability to catch bad code erodes over time. Andrews acknowledges this might be the "old man yells at cloud" argument — similar complaints arose when high-level programming languages replaced assembly. Those complaints turned out to be mostly wrong. But in manufacturing, where domain knowledge about why a PLC is configured a certain way lives in the head of one engineer who's been there 15 years, the stakes are different. The trade-off is real.
2. Artificially low cost — more nuanced than it looks. The price you're paying today for AI coding tools is subsidized. OpenAI, Anthropic, and the rest are burning through capital and current prices don't reflect true training and inference costs. However — and this is worth saying — inference costs have already dropped dramatically. What cost dollars per query two years ago costs fractions of a cent today. Hardware efficiency, model compression, and architectural improvements are real forces pushing costs down over time. The honest version: we don't know whether prices eventually normalize downward (thanks to efficiency gains) or spike upward (when investor patience runs out). Either way, building deep dependency on a specific vendor's pricing model without a contingency plan is a risk worth naming.
3. Prompt injection — the sleeper issue for OT. AI coding agents pull context from the web, from emails, from documentation. A motivated attacker can poison those sources with hidden instructions — what security researcher Bruce Schneier calls "promptware." If your agent is writing code that touches industrial systems and it's browsing the web for examples, that's an attack surface most OT security frameworks don't even have language for yet.
4. Copyright — and this one's genuinely new territory. The U.S. Supreme Court recently declined to hear an appeal, letting lower court rulings stand: AI-generated code is not copyrightable. It belongs to no one — or more precisely, everyone. That doesn't mean you can't use AI-generated code. It means if you're building proprietary industrial software and the entire codebase is AI-generated, your IP protection is murkier than you might think. A hybrid approach — humans writing the core architecture, AI accelerating the implementation — is probably the smarter play legally and technically.
Why it matters for manufacturing:
Here's the honest version: AI coding agents are genuinely great at boilerplate, documentation, test generation, translating legacy code, and accelerating engineers who already know what they're doing. For building a REST API wrapper around your historian? Fantastic. For drafting a first pass at an OT data pipeline? Useful starting point.
Where it gets risky is when the agent becomes a substitute for understanding — when nobody on the team can explain why the code works, only that it does. That's always been a problem in software. AI agents just make it easier to accumulate that kind of technical debt faster.
Real-world scenario: Your team uses an AI coding agent to build a data pipeline connecting your historian to a cloud analytics platform. The agent browses GitHub and Stack Overflow for examples, finds a compromised package reference injected by a threat actor last week, and includes it in the generated code. The rest of the code looks fine, so it sails through review. The pipeline ships. Your OT network now has a new attack vector — and nobody on the team wrote a line of the code that introduced it.
The bottom line:
The question isn't whether to use AI coding agents. It's whether your team understands the code well enough to own it when something goes wrong — because on the plant floor, something always eventually goes wrong.
You Can't Debug What You Can't See — Cloudflare Just Proved It

You Can't Debug What You Can't See — Cloudflare Just Proved It
Here's a problem that's quietly spreading across industrial IT teams: automation pipelines are getting more complex, AI agents are writing more of the code, and fewer people on the team can explain what the workflow actually does. Not conceptually — literally. Step by step, what runs first, what runs in parallel, what blocks on what.
Cloudflare just shipped a surprisingly elegant solution to this problem — and the underlying technique is worth understanding even if you never touch Cloudflare.
The details:
Cloudflare Workflows is a durable execution engine — think of it as a system for chaining together multi-step processes that need to survive failures, retries, and long wait times. Manufacturers building data pipelines, AI agents, or approval workflows on cloud infrastructure use tools like this constantly.
The new feature: every deployed workflow now automatically generates a visual diagram in the dashboard. No manual documentation. No drag-and-drop flow builder. The diagram is derived directly from the code itself.
Here's what makes this technically interesting — and why it was harder than it sounds.
Most visual workflow builders work from something declarative: a YAML file, a JSON config, a drag-and-drop canvas. The diagram and the logic are the same thing. But Cloudflare Workflows are just code — JavaScript or TypeScript with loops, conditionals, parallel branches, and nested functions. The diagram doesn't exist anywhere until you infer it.
Cloudflare's team built a parser using Abstract Syntax Trees (ASTs) to solve this. Here's what that means in plain language:
An AST is what you get when you take source code and break it down into a structured tree of its components — functions, conditions, loops, variables. Instead of reading the code as text, the parser reads it as a map of relationships. From that map, Cloudflare can determine: what runs in sequence, what runs in parallel, what waits for something else to finish.
The tricky part? Real production code gets minified before deployment — compressed into dense, nearly unreadable strings to save bandwidth. Cloudflare had to parse both the clean TypeScript and the gnarly minified output, handling a dozen different ways the same pattern could be written. They solved it using a Rust-based parser running inside a WebAssembly worker, fast enough to run at deploy time without slowing anything down.
The result is a diagram that tracks execution order using starts and resolves markers — so parallel steps that kick off at the same time appear side by side, and sequential steps stack vertically. It handles loops, branches, try/catch blocks, and nested functions.
Why it matters for manufacturing:
Your plant floor probably doesn't run Cloudflare Workflows. But the underlying problem — how do you make complex automated processes visible? — is one of the core unsolved challenges in industrial digitalization.
Think about your SCADA system. Your historian. Your MES. Your data pipeline from OPC-UA to the cloud. How many of those processes can someone on your team draw on a whiteboard, accurately, from memory? If the answer is "not many," you have a visibility problem — and it's not unique to you.
The principle Cloudflare is applying here is worth stealing: treat your infrastructure as code, and derive your documentation from the code automatically. Don't rely on someone manually keeping a Visio diagram up to date. Generate it.
This same concept applies directly to tools like Node-RED, Apache Airflow, or any workflow orchestration layer sitting in your IIoT stack. The best implementations don't make you choose between visibility and flexibility — they give you both.
Real-world scenario: Your team builds a multi-step data pipeline: read sensor values from the historian, run an anomaly detection model, trigger a work order in the CMMS if a threshold is crossed, and log the result to the data lake. Six months later, a new engineer joins the team. Without visual documentation, they spend two weeks reverse-engineering the pipeline before touching anything. With auto-generated diagrams derived from the code itself, they're productive in a day — and they can actually verify what they think they understand.
The bottom line:
The most dangerous thing in an industrial automation environment isn't complexity — it's complexity that nobody can see. If your workflows are black boxes, they're liabilities. Make them visible.
The Debugger Is the Most Powerful Tool You're Not Using
Here's a scenario that plays out on plant floors more than anyone likes to admit: a critical piece of industrial software crashes. Or behaves strangely. Or starts producing bad data. And the response is to restart it, log a ticket with the vendor, and wait — because nobody on the team actually knows how to look inside a running process and see what it's doing.
That's a solvable problem. And a seasoned exploit developer named Peter Van Eeckhoutte (corelanc0d3r) just published one of the best beginner guides to the tool that solves it: WinDBG.
The details:
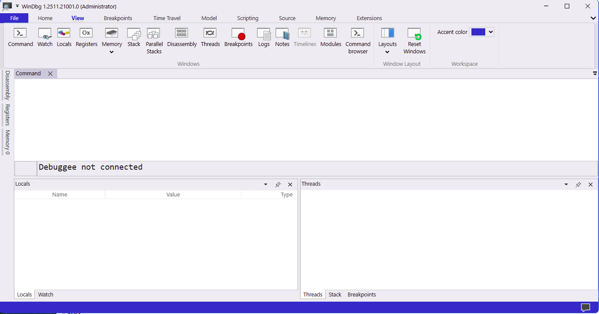
WinDBG — and its newer sibling WinDBGX — are Microsoft's free Windows debuggers. They're most commonly associated with exploit development, malware analysis, and reverse engineering. But at their core, they do something universally useful: they let you see exactly what a Windows process is doing, down to the individual CPU instruction.
Think of a debugger like turning an application into a fish bowl. You can watch what's happening, slow it down, pause it mid-execution, look at exactly what's in memory, and figure out why it's doing what it's doing — or why it crashed.
The Corelan tutorial covers the full fundamentals:
Installing and setting up both versions. WinDBG Classic is stable and consistent — it won't surprise you with a behavior change mid-project. WinDBGX is under active development with a better GUI and a powerful feature called Time Travel Debugging (TTD), which lets you record an execution and step backwards through it. Both are free. Both install in minutes.
Attaching to a process vs. opening one. This distinction matters more than it sounds. When you open an executable in a debugger, Windows silently activates heap-checking flags that change how memory behaves — meaning your debugging environment isn't the same as your production environment. When you attach to an already-running process, you see it exactly as it runs in the real world. For diagnosing production issues, attach. Always.
Stepping through execution. Two commands cover most of what you need:
t(or F11) — step into: execute one instruction, follow calls into child functionsp(or F10) — step over: execute one instruction, let calls complete without following them inside
Breakpoints. This is where the real power lives. A software breakpoint (bp) tells the debugger to pause execution the moment the CPU reaches a specific location. A hardware breakpoint (ba) tells the CPU itself to pause when a specific memory address is read, written to, or executed. You can even attach logging commands to a breakpoint — so instead of stopping the process, it silently prints register values and keeps running. That's a dynamic logging system built in one line.
Why it matters for manufacturing:
Most of the software running your plant floor runs on Windows. HMIs, historians, SCADA clients, OPC servers, MES interfaces — nearly all of it. When something goes wrong with that software, your options are usually: restart it, call the vendor, or guess.
A debugger adds a fourth option: look inside it.
That's not just useful for developers. OT security teams use debuggers to understand what a suspicious process is actually doing — not what it claims to be doing. Maintenance engineers can attach to a misbehaving HMI and see exactly what function it's stuck in before it crashes. Industrial cybersecurity analysts use these tools to analyze malware that's targeting ICS environments.
And critically: WinDBGX's Time Travel Debugging means you can record the execution of a crashing application, then step backwards through exactly what happened leading up to the crash. No more "it crashed but we don't know why." You can literally rewind the tape.
Real-world scenario: Your OPC-UA server starts dropping connections intermittently — once or twice a day, always during peak production. Restarting it clears the problem temporarily. The vendor says they can't reproduce it. With WinDBGX, you attach to the process, set a breakpoint on the connection-handling function with a pass count of 100, and let it run. When it breaks, you're looking at exactly what state the process was in the moment it started misbehaving. That's the difference between a two-week vendor ticket and a same-day root cause.
Getting started:
The full Corelan tutorial walks through every step — installation, symbol server configuration, GUI customization, and a hands-on demo application you can download and practice on. It's genuinely one of the best written technical tutorials in this space, and it's free.
A Word from This Week's Sponsor
![]()
Manufacturers don’t need more disconnected tools. They need a better way to unify data, applications, and operations.
Fuuz is an AI-driven Industrial Intelligence Platform that helps manufacturers connect siloed systems, contextualize data, and turn that data into action. With a cloud-native architecture, edge capabilities, and a low-code/no-code environment, Fuuz makes it easier to build and scale industrial applications for MES, WMS, CMMS, and more.
From data modeling and API generation to real-time flows and application design, Fuuz gives manufacturers the tools to reduce complexity, improve visibility, and create more connected, resilient operations.
Design your solution today: fuuz.com/contact-us
Learn more: fuuz.com
Kubernetes Just Got a Lot More Interesting for Industrial IT

Kubernetes Just Got a Lot More Interesting for Industrial IT
If you've spent any time around industrial IT infrastructure conversations in the past three years, you've heard two things said with great confidence and in the same breath: "We need to modernize onto containers" and "We can't migrate everything off VMs." Both are true. And until recently, they created a genuinely awkward architectural problem.
KubeVirt v1.8 just made that problem significantly more manageable.
The details:
Quick level-set for those newer to this space. Kubernetes — often abbreviated as K8s — is the dominant platform for running containerized applications at scale. Think of it as an operating system for your server infrastructure: it decides where workloads run, restarts them if they fail, scales them up and down, and manages networking between them.
Containers are lightweight, fast, and modern. But a lot of industrial software — historians, SCADA servers, legacy MES platforms — runs on full virtual machines (VMs). VMs are heavier, slower to start, but they run unmodified operating systems and software that was never designed for containers.
KubeVirt is a CNCF project that lets you run full VMs inside Kubernetes, right alongside your containers. Same orchestration layer, same networking, same monitoring tooling — but some of your workloads are containers and some are full VMs, and Kubernetes manages both.
Version 1.8, released this week, ships several upgrades that matter specifically for industrial and enterprise use cases:
Confidential computing support (Intel TDX). Confidential VMs can now cryptographically prove they're running on trusted hardware. For manufacturers handling sensitive process data, IP-critical production parameters, or regulated workloads, this is the infrastructure primitive that makes secure multi-tenant deployments believable — not just promised.
Hypervisor Abstraction Layer. KubeVirt previously assumed KVM as its hypervisor backend. The new abstraction layer opens the door to other hypervisor backends while keeping KVM as the default. In practical terms: more flexibility in where and how you deploy, and less lock-in to a single underlying technology.
Near-native AI and HPC performance in VMs. Through PCIe NUMA topology awareness and resource improvements, AI and high-performance computing workloads running inside KubeVirt VMs can now achieve near-native performance. If you're running inference workloads — say, a machine vision model or a predictive maintenance engine — in a VM alongside your other plant infrastructure, this removes one of the remaining performance arguments against doing so.
Incremental backups with Changed Block Tracking (CBT). Instead of backing up an entire VM every time, CBT captures only the data blocks that actually changed since the last backup. Faster backup windows, dramatically smaller storage footprint, and no dependency on specific storage drivers. For industrial VMs that run 24/7 and can't be easily taken offline, this is a meaningful operational improvement.
Scale testing up to 8,000 VM instances. The team validated the control plane at 8,000 concurrent virtual machine instances. The memory overhead per additional VM is measurable — about 173KB per instance on the controller — but the system holds. That's enterprise-grade scale.
Why it matters for manufacturing:
The honest reason most manufacturers haven't fully embraced Kubernetes is the VM problem. Your historian runs on Windows Server. Your SCADA server has a licensing model tied to a specific VM image. Your MES vendor doesn't support containers and won't for years. Ripping all of that out and re-platforming it into containers isn't realistic — not on a plant floor timeline, not with production dependencies that can't afford downtime.
KubeVirt's answer is: you don't have to. Migrate what you can to containers. Keep what needs to stay as VMs. Run everything under a single orchestration layer so your infrastructure team isn't managing two completely separate worlds.
That's the architectural direction the industrial IT space is quietly moving toward — not "containers replaced VMs" but "one platform that handles both."
Real-world scenario: Your plant runs a containerized OPC-UA broker, a containerized data pipeline, and a Windows Server VM running your historian — all on the same Kubernetes cluster. When the historian VM needs maintenance, Kubernetes handles the scheduling. When the OPC-UA broker needs to scale up during a high-throughput production run, Kubernetes handles that too. One team, one toolset, one place to look when something goes wrong.
The bottom line:
The gap between "modern cloud-native infrastructure" and "the reality of what's running on your plant floor" has been closing. KubeVirt v1.8 closes it a little further — and the confidential computing and backup improvements mean it's closing in the right direction.
Learning Lens
Where to Start in Digital Transformation for Manufacturers

One of the biggest takeaways from ProveIt! End users still don’t know where to start.
Not because they’re not capable. Not because they don’t care. Because what they’re being sold and what they actually need… are nowhere close to each other right now.
You’ve probably felt this. Vendors pushing solutions. Consultants talking about AI like it’s the answer to everything. And none of it lines up with what’s actually happening on your plant floor. That’s where the gap is.
That’s why we’re doing this workshop. Watch Walker explain it below—why we’re doing it, and what you should expect. Where to Start in Digital Transformation
This is a 2-day live workshop with Walker Reynolds and Dylan DuFresne.
Day 1 is the process:
Where do you actually start? How do you identify the right problems? What does a real strategy and architecture look like?
Day 2 is the application:
We walk through it step-by-step in a simulated Value Factory. Connect → Collect → Store → Analyze → Visualize → Find Patterns → Report → Solve
Not theory. What this actually looks like when you do it.
May 12–13 | Live Online
9:00am - 1pm CDT
Early Bird — $100 off through April 10
Use code START-EARLYBIRD
Learn more ->
Byte-Sized Brilliance
A modern x86 CPU executes somewhere between 100 and 300 billion instructions per second. Your SCADA workstation, your historian server, your HMI — all of them are churning through hundreds of billions of operations every single second, invisibly, continuously, without pause.
Here's the part that should stop you in your tracks: WinDBG halts all of it with a single byte.
When a debugger sets a software breakpoint, it replaces exactly one byte in memory — the first byte of the target instruction — with 0xCC. That's the INT3 instruction. One byte. When the CPU encounters it, the entire process freezes and hands control to the debugger. One byte out of billions of bytes executing per second is enough to stop the machine cold and let you look inside.
That's not just a neat trick. It's a reminder of something easy to forget when you're staring at dashboards and KPI reports: underneath every "system is running normally" indicator is an incomprehensible volume of discrete operations that nobody is watching in real time. Your predictive maintenance model, your OPC-UA data pipeline, your historian's write buffer — all of it is a waterfall of instructions that your organization has collectively decided to trust without seeing.
This week's newsletter was really about one thing: the gap between what your systems appear to be doing and what they're actually doing. AI agents that seem reliable until they aren't. Pipelines that run until nobody can explain them. Processes that crash for reasons nobody can reconstruct.
The tools exist to close that gap. Most plant floors just haven't picked them up yet.
One byte to freeze a hundred billion operations per second. The question isn't whether your systems can be seen — it's whether anyone is looking.

Responses